Describing my Data

In this assignment I walk through the various types of data that I collected in the field and describe their purpose and how they interact
news
code
analysis
Author

Alexis Means

Published

January 27, 2025

My Data

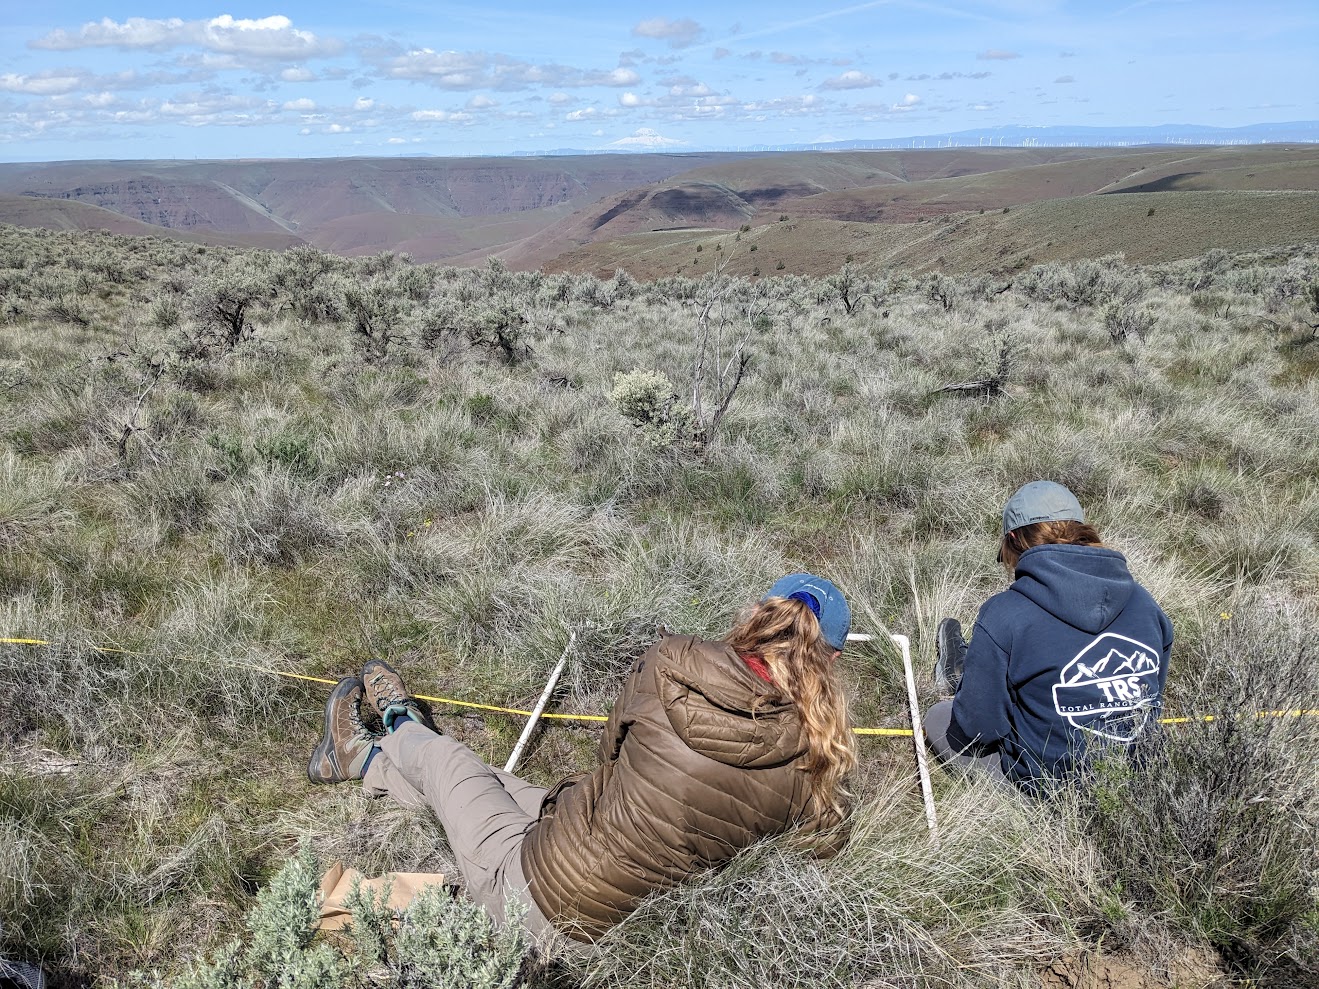
The dataset I’m using consists of vegetation monitoring data I collected during the summer of 2024 for my project. It includes multiple linked databases with varying types of information. Ultimately, these databases will be combined to create a nutritional landscape map of my study area, highlighting areas with different levels of nutritional quality.

Data Collection

My data consists of multiple linked databases containing detailed information about unique species/phenology plant pairs sampled across different transects during my field season. These databases include:

  • Vegetation communities: The different vegetation communities sampled in my study.

  • Species and phenology: The species identified in each transect along with their phenology stages.

  • Percent aerial cover: The contribution of each unique species/phenology plant pair to the total percent aerial cover within each quadrat.

  • Biomass weight: The weight of clipped and unclipped biomass for each unique plant.

In the future, I’ll also include quality information for these unique pairs, though that analysis is still in progress.

Importing my Data

Each of my datasets is saved as a separate CSV file. To load them, I first set my working directory to the folder containing these files and used the base R function read.csv to import each one. After loading, I assigned each dataset to a new object so I can easily reference them later. To confirm that each dataset loaded correctly, I used the head function to preview the first few rows. To get a better understanding of how the information is structured within each dataset, I used the glimpse function from the tidyverse package.

Code
# Set Working Directory
setwd("C:/Users/Alexis Means/Documents/School/RDS/final.project/")

# Load in each database and assign them to an object
biomass <- read.csv("processed.data/biomass_clean.csv")
comp <- read.csv("processed.data/composition_clean.csv")
pheno <- read.csv("processed.data/phenology_clean.csv")
plants <- read.csv("processed.data/plant_list_clean.csv")
quality <- read.csv("processed.data/quality_clean.csv")
transect <-read.csv("processed.data/transect_clean.csv")

# Load tidyverse
library(tidyverse)

Biomass

Code
# Check that each database has been loaded correctly  
# Use glimpse command to summarize each of my dataframes 
head(biomass)
  X DryWeight.g.                comp_id
1 1        31.11   24-672-020_60_BRTE_N
2 2         4.03  24-672-020_60_AMME_FL
3 3         0.64  24-672-020_60_LIPA_FL
4 4         6.17 24-672-020_100_BRTE_FL
5 5         5.09  24-672-020_100_LOGR_N
6 6         5.10 24-672-020_100_PSSP6_N
Code
glimpse(biomass)
Rows: 5,563
Columns: 3
$ X            <int> 1, 2, 3, 4, 5, 6, 7, 8, 9, 10, 11, 12, 13, 14, 15, 16, 17…
$ DryWeight.g. <dbl> 31.11, 4.03, 0.64, 6.17, 5.09, 5.10, 0.34, 0.22, 1.25, 1.…
$ comp_id      <chr> "24-672-020_60_BRTE_N", "24-672-020_60_AMME_FL", "24-672-…

Composition

Code
head(comp) 
      PlotID Quadrat spp_code Pheno PlotID_short  composition_id
1 24-672-020      20     BRTE    FL          672  672_20_BRTE_FL
2 24-672-020      20    ERCI6    FL          672 672_20_ERCI6_FL
3 24-672-020      40     LOGR    FL          672  672_40_LOGR_FL
4 24-672-020      40     BRTE     M          672   672_40_BRTE_M
5 24-672-020      60     BRTE     N          672   672_60_BRTE_N
6 24-672-020      60     AMME    FL          672  672_60_AMME_FL
Code
glimpse(comp)
Rows: 3,125
Columns: 6
$ PlotID         <chr> "24-672-020", "24-672-020", "24-672-020", "24-672-020",…
$ Quadrat        <int> 20, 20, 40, 40, 60, 60, 60, 80, 80, 80, 80, 80, 80, 80,…
$ spp_code       <chr> "BRTE", "ERCI6", "LOGR", "BRTE", "BRTE", "AMME", "LIPA"…
$ Pheno          <chr> "FL", "FL", "FL", "M", "N", "FL", "FL", "N", "FL", "FL"…
$ PlotID_short   <int> 672, 672, 672, 672, 672, 672, 672, 672, 672, 672, 672, …
$ composition_id <chr> "672_20_BRTE_FL", "672_20_ERCI6_FL", "672_40_LOGR_FL", …

Phenology

Code
head(pheno) 
      PlotID Quadrat Percent Pheno                       comp_id
1 24-672-020      20      10    FL  24-672-020_20_BRTE_FL_ENTIRE
2 24-672-020      20       1    FL 24-672-020_20_ERCI6_FL_ENTIRE
3 24-672-020      40       5    FL  24-672-020_40_LOGR_FL_ENTIRE
4 24-672-020      40      10     M   24-672-020_40_BRTE_M_ENTIRE
5 24-672-020      60      35     N   24-672-020_60_BRTE_N_ENTIRE
6 24-672-020      60       5    FL  24-672-020_60_AMME_FL_ENTIRE
           spp_id
1  BRTE_FL_ENTIRE
2 ERCI6_FL_ENTIRE
3  LOGR_FL_ENTIRE
4   BRTE_M_ENTIRE
5   BRTE_N_ENTIRE
6  AMME_FL_ENTIRE
Code
glimpse(pheno)
Rows: 3,125
Columns: 6
$ PlotID  <chr> "24-672-020", "24-672-020", "24-672-020", "24-672-020", "24-67…
$ Quadrat <int> 20, 20, 40, 40, 60, 60, 60, 80, 80, 80, 80, 80, 80, 80, 100, 1…
$ Percent <int> 10, 1, 5, 10, 35, 5, 5, 15, 1, 5, 5, 10, 5, 10, 5, 10, 10, 1, …
$ Pheno   <chr> "FL", "FL", "FL", "M", "N", "FL", "FL", "N", "FL", "FL", "N", …
$ comp_id <chr> "24-672-020_20_BRTE_FL_ENTIRE", "24-672-020_20_ERCI6_FL_ENTIRE…
$ spp_id  <chr> "BRTE_FL_ENTIRE", "ERCI6_FL_ENTIRE", "LOGR_FL_ENTIRE", "BRTE_M…

Species List

Code
head(plants) 
  X spp_code       Family       Genus        Spp           CommonName  Duration
1 1    ARRI2   ASTERACEAE   ARTEMISIA     RIGIDA      STIFF SAGEBRUSH PERENNIAL
2 2    ARTRT   ASTERACEAE   ARTEMISIA TRIDENTATA  BASIN BIG SAGEBRUSH PERENNIAL
3 3    GUSA2   ASTERACEAE GUTIERREZIA  SAROTHRAE      BROOM SNAKEWEED PERENNIAL
4 4    ERCI6     GERANIUM     ERODIUM CICUTARIUM   REDSTEM STORKSBILL    ANNUAL
5 5     LODI     APIACEAE    LOMATIUM  DISSECTUM FERNLEAF BISCUITROOT PERENNIAL
6 6     AMME BORAGINACEAE   AMSINCKIA  MENZIESII    COMMON FIDDLENECK    ANNUAL
Code
glimpse(plants)
Rows: 101
Columns: 7
$ X          <int> 1, 2, 3, 4, 5, 6, 7, 8, 9, 10, 11, 12, 13, 14, 15, 16, 17, …
$ spp_code   <chr> "ARRI2", "ARTRT", "GUSA2", "ERCI6", "LODI", "AMME", "LIPA",…
$ Family     <chr> "ASTERACEAE", "ASTERACEAE", "ASTERACEAE", "GERANIUM", "APIA…
$ Genus      <chr> "ARTEMISIA", "ARTEMISIA", "GUTIERREZIA", "ERODIUM", "LOMATI…
$ Spp        <chr> "RIGIDA", "TRIDENTATA", "SAROTHRAE", "CICUTARIUM", "DISSECT…
$ CommonName <chr> "STIFF SAGEBRUSH", "BASIN BIG SAGEBRUSH", "BROOM SNAKEWEED"…
$ Duration   <chr> "PERENNIAL", "PERENNIAL", "PERENNIAL", "ANNUAL", "PERENNIAL…

Quality

Code
head(quality) 
  X Code season PVT         spp_id quality_id
1 1 BRTE     NA 672 BRTE_FL_ENTIRE         NA
2 2 BRTE     NA 672 BRTE_FL_ENTIRE         NA
3 3 BRTE     NA 672 BRTE_FR_ENTIRE         NA
4 4 BRTE     NA 672 BRTE_FL_ENTIRE         NA
5 5 BRTE     NA 672 BRTE_FL_ENTIRE         NA
6 6 BRTE     NA 672 BRTE_FL_ENTIRE         NA
Code
glimpse(quality) 
Rows: 631
Columns: 6
$ X          <int> 1, 2, 3, 4, 5, 6, 7, 8, 9, 10, 11, 12, 13, 14, 15, 16, 17, …
$ Code       <chr> "BRTE", "BRTE", "BRTE", "BRTE", "BRTE", "BRTE", "BRTE", "BR…
$ season     <lgl> NA, NA, NA, NA, NA, NA, NA, NA, NA, NA, NA, NA, NA, NA, NA,…
$ PVT        <int> 672, 672, 672, 672, 672, 672, 672, 672, 672, 672, 672, 672,…
$ spp_id     <chr> "BRTE_FL_ENTIRE", "BRTE_FL_ENTIRE", "BRTE_FR_ENTIRE", "BRTE…
$ quality_id <lgl> NA, NA, NA, NA, NA, NA, NA, NA, NA, NA, NA, NA, NA, NA, NA,…

Transects

Code
head(transect) 
       Date     PlotID PVT Aspect Elev BeginLat BeginLong   MidLat   MidLong
1  4/2/2024 24-672-020 672      S 1063 45.50515 -120.4193 45.50513 -120.4196
2  4/6/2024 24-672-079 672     SW 1176 45.47389 -120.4584 45.47359 -120.4584
3  4/8/2024 24-672-011 672     NE 1890 45.43403 -120.4673 45.43448 -120.4675
4  4/9/2024 24-672-089 672      N 2503 45.30245 -120.6339 45.30209 -120.6336
5 4/10/2024 24-672-116 672     NW 2286 45.35830 -120.4626 45.35857 -120.4621
6 4/11/2024 24-672-014 672     NE 2370 45.33468 -120.5660 45.33509 -120.5663
    EndLat   EndLong Moved season
1 45.50496 -120.4203     0     SP
2 45.47328 -120.4579     0     SP
3 45.43493 -120.4675     0     SP
4 45.30174 -120.6332     0     SP
5 45.35889 -120.4615     0     SP
6 45.33546 -120.5666     1     SP
Code
glimpse(transect)
Rows: 69
Columns: 13
$ Date      <chr> "4/2/2024", "4/6/2024", "4/8/2024", "4/9/2024", "4/10/2024",…
$ PlotID    <chr> "24-672-020", "24-672-079", "24-672-011", "24-672-089", "24-…
$ PVT       <int> 672, 672, 672, 672, 672, 672, 674, 672, 672, 672, 669, 672, …
$ Aspect    <chr> "S", "SW", "NE", "N", "NW", "NE", "SE", "SE", "N", "N", "W",…
$ Elev      <int> 1063, 1176, 1890, 2503, 2286, 2370, 1288, 1542, 1422, 1394, …
$ BeginLat  <dbl> 45.50515, 45.47389, 45.43403, 45.30245, 45.35830, 45.33468, …
$ BeginLong <dbl> -120.4193, -120.4584, -120.4673, -120.6339, -120.4626, -120.…
$ MidLat    <dbl> 45.50513, 45.47359, 45.43448, 45.30209, 45.35857, 45.33509, …
$ MidLong   <dbl> -120.4196, -120.4584, -120.4675, -120.6336, -120.4621, -120.…
$ EndLat    <dbl> 45.50496, 45.47328, 45.43493, 45.30174, 45.35889, 45.33546, …
$ EndLong   <dbl> -120.4203, -120.4579, -120.4675, -120.6332, -120.4615, -120.…
$ Moved     <int> 0, 0, 0, 0, 0, 1, 0, 0, 1, 0, 0, 0, 0, 0, 1, 0, 0, 0, 0, 0, …
$ season    <chr> "SP", "SP", "SP", "SP", "SP", "SP", "SP", "SP", "SP", "SP", …
Describing my Data

These datasets come together to create a multidimensional table with all kinds of information about the species observed in my transects. Each table focuses on a unique combination of species ID and phenology stage, which is what I’m using as the main unit of observation. To describe each of these unique combinations, I’ve included several attributes. The quantitative ones include things like biomass weight, percent aerial cover, and nutritional quality. There are also some categorical attributes, like the vegetation community where the species was found and the season it was observed. For now, I’m working with this data as a table to calculate summary statistics, but eventually, I’ll convert it into spatial data. I’ve also included a table that lists and explains all the attributes—some are repeated across datasets, so I’ve only described them once. Going through this process has made me realize my data isn’t as tidy as I thought, which has been a good learning experience!

Code
table<- read.csv("C:/Users/Alexis Means/Documents/School/BCB520/2A/attributes.csv") 
knitr::kable(table)
Attribute Type Note
DryWeight Quantitative This measurement tells us what the weight of dry biomass is for each specific observation
PlotID Categorical This descriptor is a unique ID that tells us which randomized point we sampled
Quadrat Categorical There are 5 quadrats that we sample for each quadrat (20,40,60,80,100)
spp_code Categorical These are unique codes that describe the family, genius and species for every item observed
pheno Categorical Each species is assigned a growth stage when we observe it - New, Budding, Flowering, Fruiting, Mature or Cured (N, B, FL, FR, M, C)
PVT Categorical This number describes the vegetation community that was being sampled, we have 5 total for the study area, it is used as part of the descriptor for each plotID
composition_ID Categorical This unique ID helps link the biomass and aerial percent cover to specific plots and quadrats, rather than just the species and phenology stage
percent Quantitative This measurement tells us the percent cover that each composition_id occupies within a 1x1m quadrat
spp_id Categorical This unique ID is slightly more broad and will be used to identify species/phenology combinations within each vegetation type as well as the season
Family Categorical This will be used to group quality data if we do not have enough information to determine the quality down to the smaller scale (genus)
Genus Categorical This will be used to group quality data if we do not have enough information to determine the quality down to the smaller scale (spp)
Spp Categorical This will be used to group quality data if we do not have enough information to determine the quality down to the smaller scale (phenological stage)
CommonName Categorical This is another identifier for each species, it will likely not be used within the analysis so it could be removed
Duration Categorical This is another category I may use to group quality data based on the growth duration of each species
Status Categorical Each species is categorized as native or invasive
Season Categorical Our observations are grouped based on the date that they were sampled (Spring, Summer and Fall) to observe the changes in nutritional quality
Date Categorical This keeps track of the day that each observation was sampled
Aspect Categorical Described the direction the hill was facing that each of our transects had been sampled on
Elev Quantitative Describes the elevation that each of the transects was sampled at
Lat/Long Categorical Each of the lat/long pairs plots the beginning, middle and end of each of the transects
Moved Categorical Tells us whether the orginal randomized point had to be moved