Code
#Clean the comp dataset and create a new column for family proportions
fam_prop<- comp %>%
mutate(spp_code = str_trim(spp_code)) %>%
filter(!str_to_lower(spp_code) %in%
str_to_lower(c("Litter", "Water", "Lichen", "Rocks", "Earth"))) %>%
left_join(plants, by = "spp_code") %>%
count(Family) %>%
arrange(n) %>%
mutate(proportions = n/sum(n)* 100) %>%
rename(fam_count = n)
#create a new object with the top 10 species in descending order
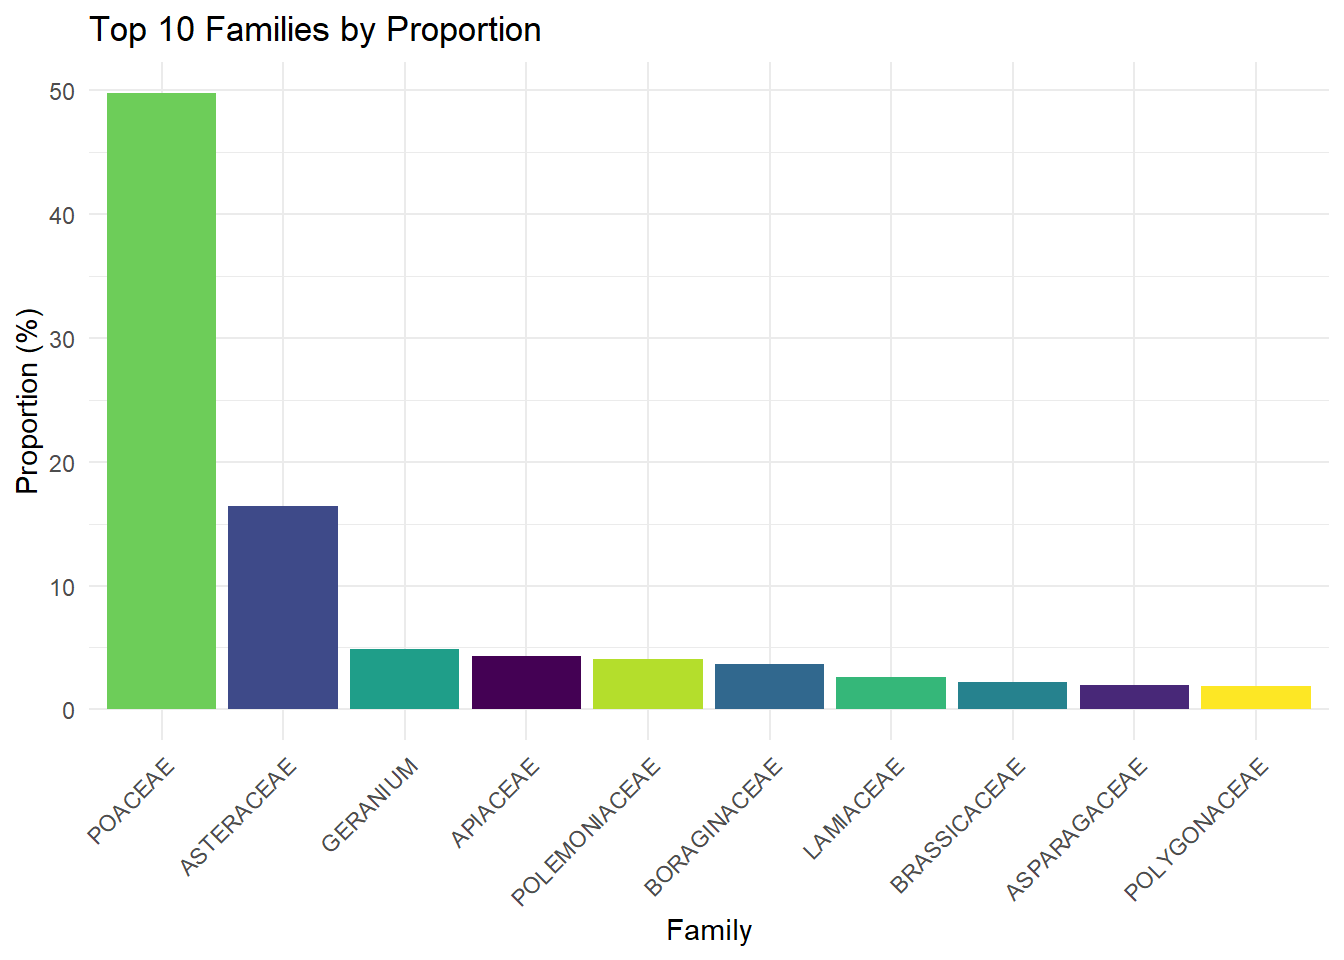
top_fam <- fam_prop %>%
arrange(desc(proportions)) %>%
slice_head(n = 10)
#create boxplot of the top 10 families
ggplot(top_fam, aes(x = fct_reorder(Family, -proportions), y = proportions, fill = Family)) +
geom_bar(stat = "identity") +
scale_fill_viridis_d(option = "viridis") +
labs(
x = "Family",
y = "Proportion (%)",
title = "Top 10 Families by Proportion"
) +
theme_minimal() +
theme(
axis.text.x = element_text(angle = 45, hjust = 1),
legend.position = "none")